In today’s digitally saturated environment, the importance of presenting information in an easy-to-digest format cannot be overstated. Infographics have emerged as a powerful vehicle for accomplishing this, transforming complicated data sets or verbose explanations into visually compelling stories. However, the misconception prevails that creating an infographic is a task best left to graphic design experts. This could not be further from the truth. Clipart offers an accessible, user-friendly way to design compelling visuals.
Whether you’re an educator looking to elucidate complex subjects for your students, a marketer trying to attract potential customers, or an individual aiming to distill an intricate topic, this guide is for you. It will delve into the nitty-gritty of employing clipart to craft engaging infographics.
Why Choose Clipart for Infographics?
Budget-Friendly
One of the main advantages of using clipart is its cost-effectiveness. Hiring a professional graphic designer can burn a hole in your pocket, particularly if you need multiple infographics or have to make frequent updates. Clipart offers a treasure trove of design elements either for free or at a minimal price, making it an ideal choice for those on a tight budget.
Ease of Use
Design novices, worry not. Clipart is incredibly user-friendly, offering a simple way to enhance your infographics. You don’t need extensive training or familiarity with complex software to get started. With just a few clicks, you can download and insert clipart into your design, making the process painless and straightforward.
Variety and Versatility
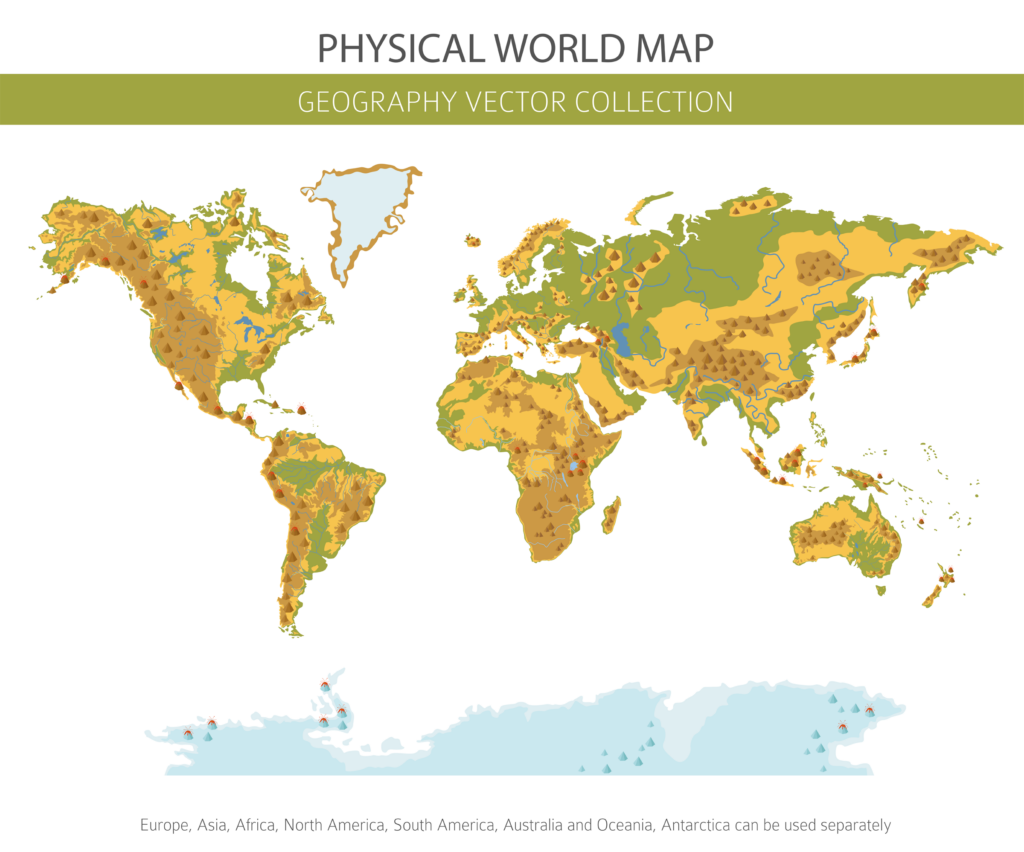
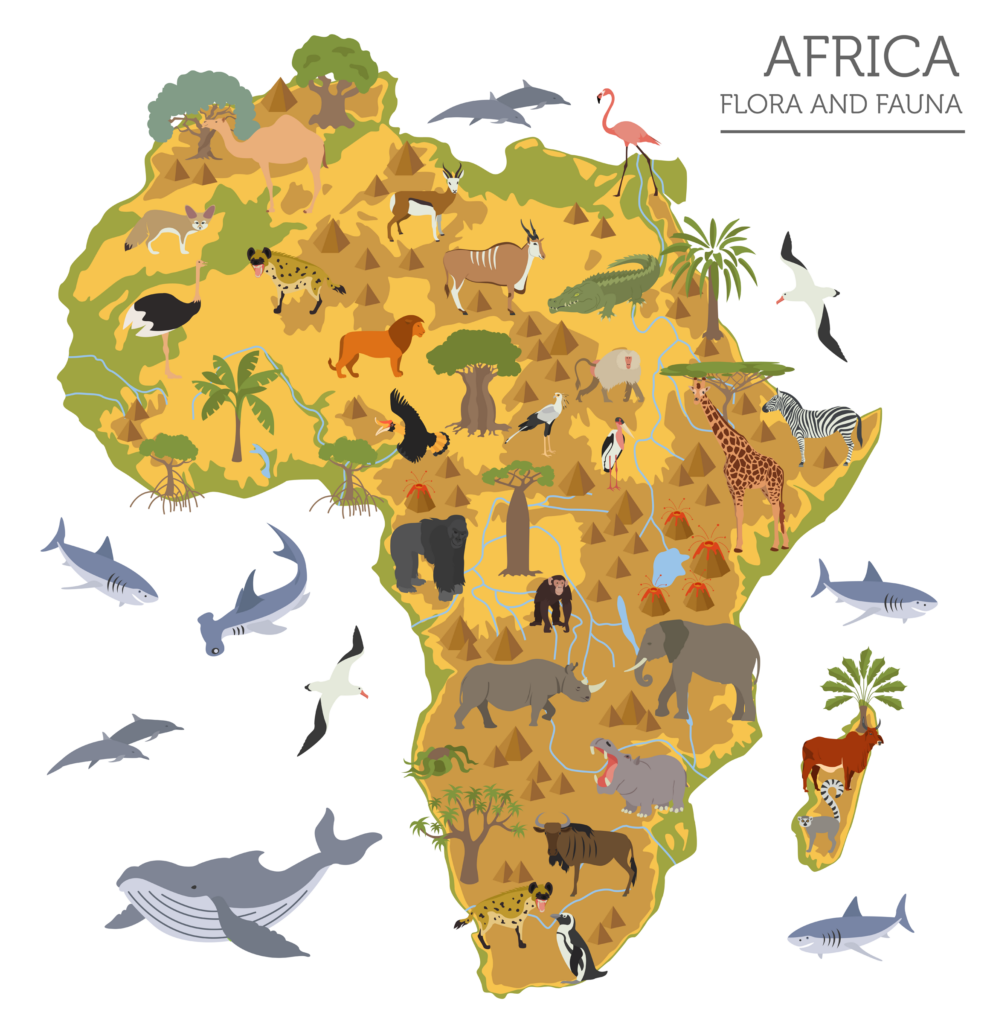
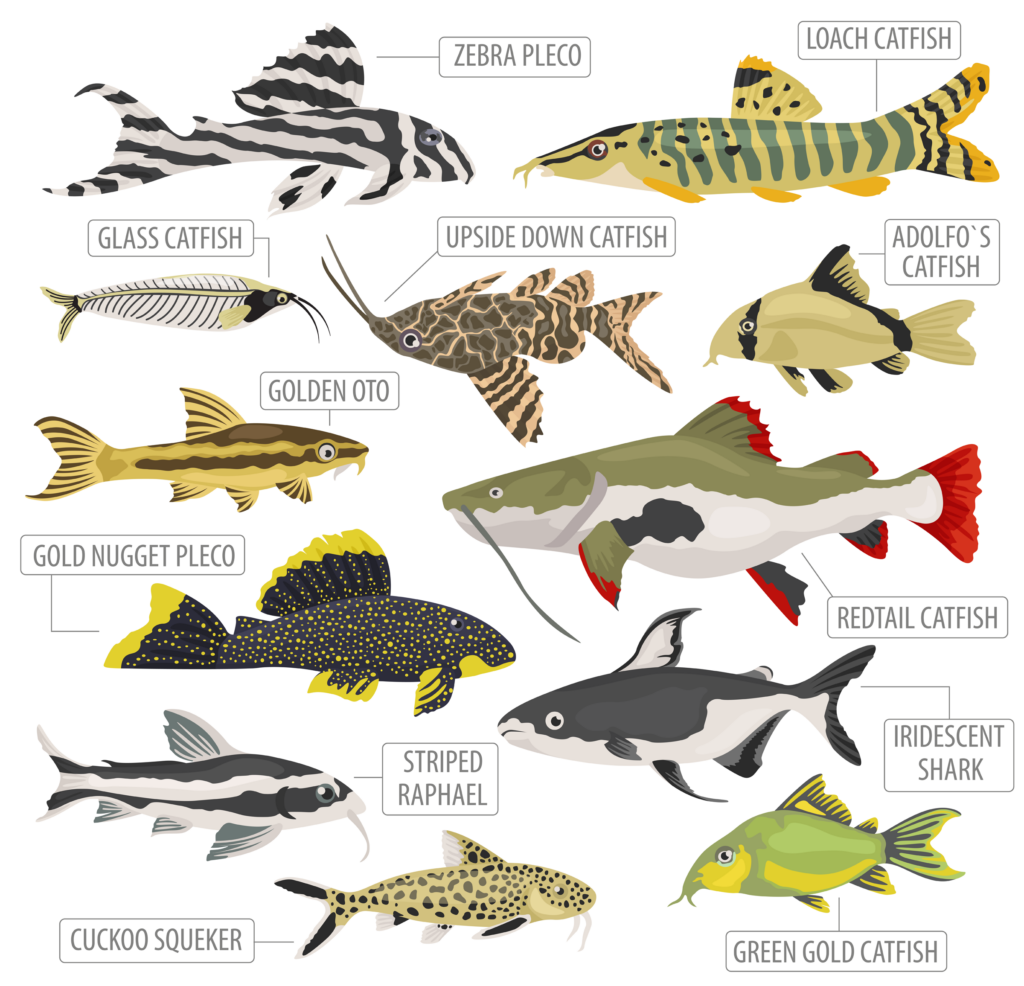
The sheer array of choices available in clipart libraries like Clipart’s educational repository means that you are likely to find something that fits your specific needs. Whether you’re working on a science presentation, a historical timeline, or a marketing strategy, there’s a clipart for that. The versatility allows you to adapt different pieces to various themes, subjects, and audiences.
Speed and Efficiency
When you’re racing against the clock, clipart is your ally. Unlike creating graphics from scratch, clipart comes ready-to-use. You can quickly search for relevant images, download them, and insert them into your infographics, thereby dramatically reducing the time and effort needed to complete your project.
Customization Options
While clipart comes ready to use, most platforms allow some level of customization. This means you can change colors, add text, or even combine several clipart images to create a unique design element, providing a personalized touch to your infographic.
Availability and Accessibility
Clipart libraries are widely available online, and many offer mobile-friendly options. This means you can work on your infographic anytime, anywhere, making it convenient for those with busy schedules or those who are constantly on the move.
Consistency and Cohesion
Utilizing clipart can help maintain a consistent look and feel throughout your infographic. Consistent visuals contribute to a more polished, professional final product that can hold the viewer’s attention longer and convey information more effectively.
Wide Appeal
Clipart is not bound by language barriers or cultural differences to the same extent as text, making it universally appealing. This broadens the potential audience for your infographic, making it more effective on a global scale.
Steps to Create an Infographic Using Clipart
1. Plan the Layout
Before even opening your design software, it’s crucial to plan the layout of your infographic. This includes determining the order of sections, the flow of information, and the positioning of clipart. Creating a rough sketch or outline can serve as your guide, helping you visualize the final product and avoid costly mistakes during the design phase.
2. Choose the Right Clipart
The selection process is pivotal in creating a compelling infographic. Your chosen clipart should not only be aesthetically pleasing but also relevant to the data or topic you are covering. Make sure to consider the style, color scheme, and overall vibe of the clipart. It should seamlessly integrate with the rest of your design and enhance, not distract from, the information being presented.
3. Use Editing Software
Once you’ve selected your clipart, the next step is to import it into a graphic editing software. Programs like Adobe Illustrator or free alternatives such as Canva offer a range of options to customize your clipart. You can resize, recolor, and reposition the images to fit them perfectly into your layout.
4. Place Clipart Strategically
The positioning of your clipart plays a significant role in how your audience interacts with the infographic. Clipart can act as eye-catching section headers, visual dividers between different topics, or as focal illustrations that encapsulate the core message of a section. Thoughtful placement can guide the viewer’s eye and enhance their comprehension of the material.
5. Maintain Consistency
Visual consistency is key to producing an effective infographic. The clipart style, size, and color should be coherent throughout. Consistency creates a unified visual language, making your infographic look professional and easy to follow.
6. Add Text and Data
Clipart should serve as a complementary element to the text and data in your infographic. Use straightforward, legible fonts and color-coded charts or graphs to help convey your message. The text and clipart should work in tandem to deliver a clear, impactful narrative.
7. Review and Revise
Before finalizing your infographic, take a step back and review it critically. Check for any inconsistencies in design, assess the flow of information, and ensure that the clipart serves its intended purpose. Don’t hesitate to make revisions; it’s far better to spend extra time perfecting your work than to publish something subpar.
8. Export and Share
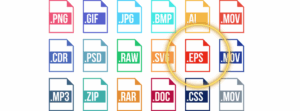
Once you’re satisfied with your infographic, the final step is to export it in the appropriate format. PNG or PDF formats are generally the best choices for retaining image quality. Once exported, your infographic is ready to be shared across various platforms or printed for physical distribution.
How to Optimize Clipart for SEO and Web Use
While your primary goal may be creating a visually engaging infographic, it’s essential to consider its web performance and SEO as well. After all, what’s the point of a fantastic infographic if no one sees it? Here are some tips for optimizing your clipart-based infographic for web use.
File Size and Format
Large files can slow down webpage loading times, leading to a poor user experience and potentially affecting SEO rankings. Opt for formats like JPEG or PNG that provide good quality but keep file sizes manageable.
Alt Text and Meta Descriptions
Don’t neglect the technical aspects when uploading your infographic online. Adding relevant alt text and meta descriptions can improve SEO and make your infographic more accessible to people with visual impairments.
How to Find Quality Clipart for Your Infographics

When searching for clipart, not just any image will do. The quality of image can make or break your infographic. As you embark on your clipart quest, keep these tips in mind.
Source from Reputable Websites
Stick to reputable sources when searching for clipart. Websites like Clipart’s educational repository offer a wide range of high-quality, customizable clipart images that can elevate your infographic.
Look for Customization Features
As previously mentioned, the ability to customize clipart can give your infographic a unique flair. Seek out platforms that offer customization options like color changes, resizing, or even layering multiple clipart images.
Check Licensing and Copyrights
Be aware of the licensing terms associated with the clipart you choose. Always give appropriate credit if required, and make sure you’re not infringing on any copyrights.
Crafting an engaging, visually pleasing infographic doesn’t have to be a daunting task reserved for design gurus. Clipart offers a versatile, budget-friendly, and user-friendly avenue for presenting data and narratives in an eye-catching manner. With careful planning, thoughtful clipart selection, and attention to detail, anyone can create a compelling infographic that not only serves its educational purpose but also excels in its design. So, the next time you’re tasked with converting complex data into a digestible format, remember that clipart is not just child’s play—it’s a potent tool for effective visual communication.